Food sensory research

Sensory science for food that feels, sounds and tastes right.

DADA SEN is the sensory research practice of DADA. We combine trained panels, instruments and data analysis to understand how food is perceived, and to turn that understanding into better products.

Texture & crispnessAcoustic analysisAroma & e-noseConsumer panelsProduct optimization
What we do

Six ways we study how food is perceived.

Every project pairs what people report with what instruments measure, so a result can be explained as well as observed.

Texture & crispness

Instrumental force and sound measurements that turn crunch, snap and softness into objective numbers.

Acoustic analysis

Frequency analysis of mastication and crunch sounds, linked to what panels report.

Aroma & e-nose

Volatile fingerprints and molecular modelling that explain perceived aroma.

Consumer & trained panels

Blind-coded hedonic and descriptive studies, designed and analysed with proper statistics.

Product optimization

Formulation work guided by panel feedback and instruments, from new flours to process changes.

Market & consumer insight

Secondary market research and consumer-behaviour studies for food and confectionery.

Selected work

Research and projects.

A selection of our sensory work. Detailed datasets are shared with partners under agreement, and unpublished studies are described in outline only.

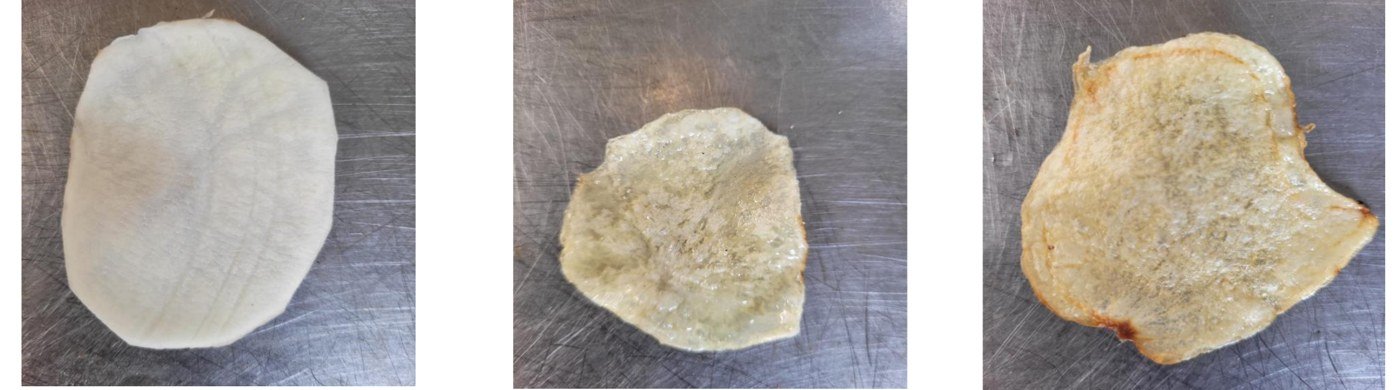
Potato chip slices at three frying stages: initial, optimally fried and over fried
Frying stages used to link crunch sound to texture and consumer acceptance.
TextureAcousticAI

Acoustic digital twin for crispy snacks

An on-site application that listens to the crunch. A neural network links acoustic amplitude to measured hardness and perceived crispness, and estimates how long a product needs to fry, closing the loop between the fryer and the consumer.

  • Sound characteristics tested against consumer acceptability
  • Prediction of hardness, crispness and frying-time adjustments
  • Presented at ICFoST 2025, NIFTEM-T Thanjavur
Illustration of a crunch sound wave.
Signal processingR Shiny

Hearing what the panel hears

Microphone recordings and subjective mastication sounds are processed with frequency analysis, so the same crunch can be described in numbers and in words.

  • Acoustic features extracted from raw recordings
  • Delivered as a web app so QC can test on the factory floor
Illustration of a muffin formulation series.
Product optimizationSensory panelTexture

Low-gluten muffins from jackfruit seed flour

A product optimization study that uses jackfruit seed flour to lower gluten while keeping a muffin people enjoy. Sensory panels and instrumental measurements guide the formulation toward the best balance of texture, colour and overall acceptability.

  • Formulation guided by panel feedback and instrument data
  • Presented as a poster at ICFoST 2024
  • Full results will be released with the publication
E-nose signalReceptor dockingSensory note
Concept: instrument markers, receptor model, perceived aroma (illustrative).
E-noseMolecular simulationAroma

From volatile compound to perceived aroma

For regional coffees, e-nose data identifies the compounds that define each sample. These are then simulated against a human olfactory receptor to explain, at a molecular level, why a panel reports notes such as roasted, citrus or spicy.

  • Instrument markers, receptor simulation and panel results aligned in one report
  • Reproducible R-based pipeline with 3D molecular visualisation

Tools behind the work

Crispness rigForce and sound capture for instrumental crispness scoring.
Electronic noseBiomimetic nasal chamber with gas sensing for aroma classification.
Trained and consumer panelsBlind-coded sessions with hedonic and descriptive scoring.
Market & consumer dataSecondary market research and consumer-behaviour models linking product design to demand.
Market & consumer research

Understanding the market around the product.

Good sensory work meets real demand. We also size markets and map consumer behaviour from public data and field surveys, using the same structured, evidence-first approach.

78%three social pillarsBirthdays35%Festivals28%Weddings15%Other occasions22%
Share of bulk chocolate gifting value by occasion, FY25.
Market sizingSecondary researchConsumer segmentation

Sizing the bulk chocolate and candy market in India

A secondary-research study of wholesale-format chocolate and candy across petty retail, organised retail, e-commerce and institutional channels. Government licensing data was combined with a telephone field survey to estimate addressable demand and to segment consumption by occasion.

  • Addressable market estimated at about ₹4,770 Cr for FY25
  • Birthdays, festivals and weddings drive roughly 78% of value
  • Secondary packaging identified as the trigger that turns one product into several use cases
57,911premium outlets identified
3regulatory frameworks mapped
2complementary sizing methods
Headline structure of the HORECA feasibility study.
FeasibilityB2BRegulatory mapping

Customised candy in India's premium HORECA sector

A feasibility study for brand-imprinted candy in hotels, restaurants, cafés and bars. The premium sector was defined from three independent frameworks: hotel classification, FSSAI licensing and state excise licences. It was then sized with a guest-volume method for hotels and a per-outlet order-value method for the rest.

  • Covers procurement practices, competitive landscape and occasion-based use
  • Every figure traced to government data and published industry reports

Acquire

Government and industry sources.

Segment

Channels, outlets and occasions.

Clean

Reconcile and correct with survey data.

Analyse

Size the addressable market.

Interpret

Visualise and report the findings.

Recognition

Peer-reviewed in the room, recognised on the podium.

Awards, certificates and podium moments, in one place.

    NIT Rourkela · AI-enabled computer vision for food quality, workshop
    NIFTEM-T · Advanced HACCP (practical)
    Industry R&D · Jackfruit value addition & millet husk upcycling
    SP

    Santhoshkumar Perumal

    Founder & CEO, DADA

    M.Tech Food Process Engineering, NIT Rourkela
    B.Tech Food Technology, NIFTEM-Thanjavur

    About

    A food technologist who also writes the code.

    DADA (Digital Analogues and Data Analytics) is a student-founded startup from Tamil Nadu that digitalises data analytics and evaluation for the food industry. DADA SEN is its sensory research practice.

    That mix of bench science, hardware and software is the point: every DADA SEN tool started as a real experiment on real food.

    DADA received the Best Innovative Start-up Award at NIFTEM-T's World Food Day 2026 event.

    Now in development · Pilot partners welcome

    DADA SEN software: the all-in-one food sensory platform.

    The tools from our research, brought together in one platform. DADA SEN software unites human sensory panels, instrumental texture, acoustic analysis, electronic nose and AI analytics, so food teams can go from a tasting session to a decision without juggling spreadsheets.

    Panel profile

    Acoustic signature

    Product map · instrumental vs. sensory

    The platform

    One workspace for the entire sensory lifecycle.

    Food sensory work is usually scattered across paper score sheets, instrument exports and statistics scripts. DADA SEN software is built to bring those together, from planning a test to reporting the result.

    Human panel studies

    Design tests, code samples blind, collect hedonic, CATA and intensity scores on any device and manage assessors in one place.

    Texture & acoustic analytics

    Turn compression curves and crunch sounds into objective hardness and crispness indicators for snacks, bakery and more.

    Aroma & e-nose fingerprints

    Capture volatile profiles, rank the compounds that drive a product and link them to what the panel actually smelled.

    AI prediction models

    Neural-network models that predict sensory scores from instrument data, to cut tasting load and flag drift between batches.

    Statistics, built in

    ANOVA, PCA, multi-factor analysis and correlation between human and instrument data, with clean charts ready to report.

    Connected to your plant

    Sensory results can sit beside batches, quality records and suppliers inside FIMS, so every score is traceable to a production lot.

    Workflow

    From sample to decision in five steps.

    Plan

    Define products, attributes and the panel. Samples get blind codes automatically.

    Capture

    Panelists score on-screen while instruments stream texture, sound and aroma data.

    Correlate

    Human and instrument data are aligned and tested statistically.

    Predict

    Trained models estimate sensory outcomes and recommend process adjustments.

    Report

    One-click reports and dashboards for R&D, QC and management.

    Connected

    Part of the DADA ecosystem.

    DADA SEN software is designed to plug into FIMS, DADA's ERP and HRMS platform for food manufacturers, so every sensory result can sit beside the batch, supplier and quality record it belongs to.

    Want to see how the software grew out of real experiments? The Portfolio tab shows the research it is built on.

    View the portfolio
    Let's talk

    Work with DADA SEN.

    Sensory research, product optimization or a software pilot for your lab: tell us what you taste, test or measure.